Underwriting With The Property Analyzer
A step-by-step guide and case study for underwriting an STR with our Property Analyzer—revenue bands, comps, seasonality, financing, and investor metrics.
Underwriting With The Property Analyzer
The Property Analyzer helps you underwrite a short‑term rental by combining market‑based revenue estimates, comparable listings, seasonality, and a flexible financing/expense model. This guide walks you through a complete underwriting workflow using a real‑world style case study.
What You’ll Learn
- How to analyze any address and interpret the revenue ranges
- How to select a seasonality band and understand monthly patterns
- How to calibrate comparables and bedrooms/bathrooms/guest counts
- How to enter financing and operating assumptions
- How to evaluate cap rate, DSCR, cash‑on‑cash, and cash flow
- How to export a clean, shareable PDF underwriting package
Case Study: 3‑Bed in a Suburban Market
We’ll underwrite a hypothetical 3‑bed, 2‑bath single‑family home in a suburban market. The address and numbers below are illustrative, but mirror typical outcomes our users see in similar U.S. markets.
- Target Address: 123 Meadow Lane, Suburbia, TX
- Property Type: Single Family • 3 bed • 2 bath • Sleeps 8
- List Price (assumed): $525,000
- Use Case: Evaluate revenue, expenses, and financing to confirm DSCR and cash‑on‑cash
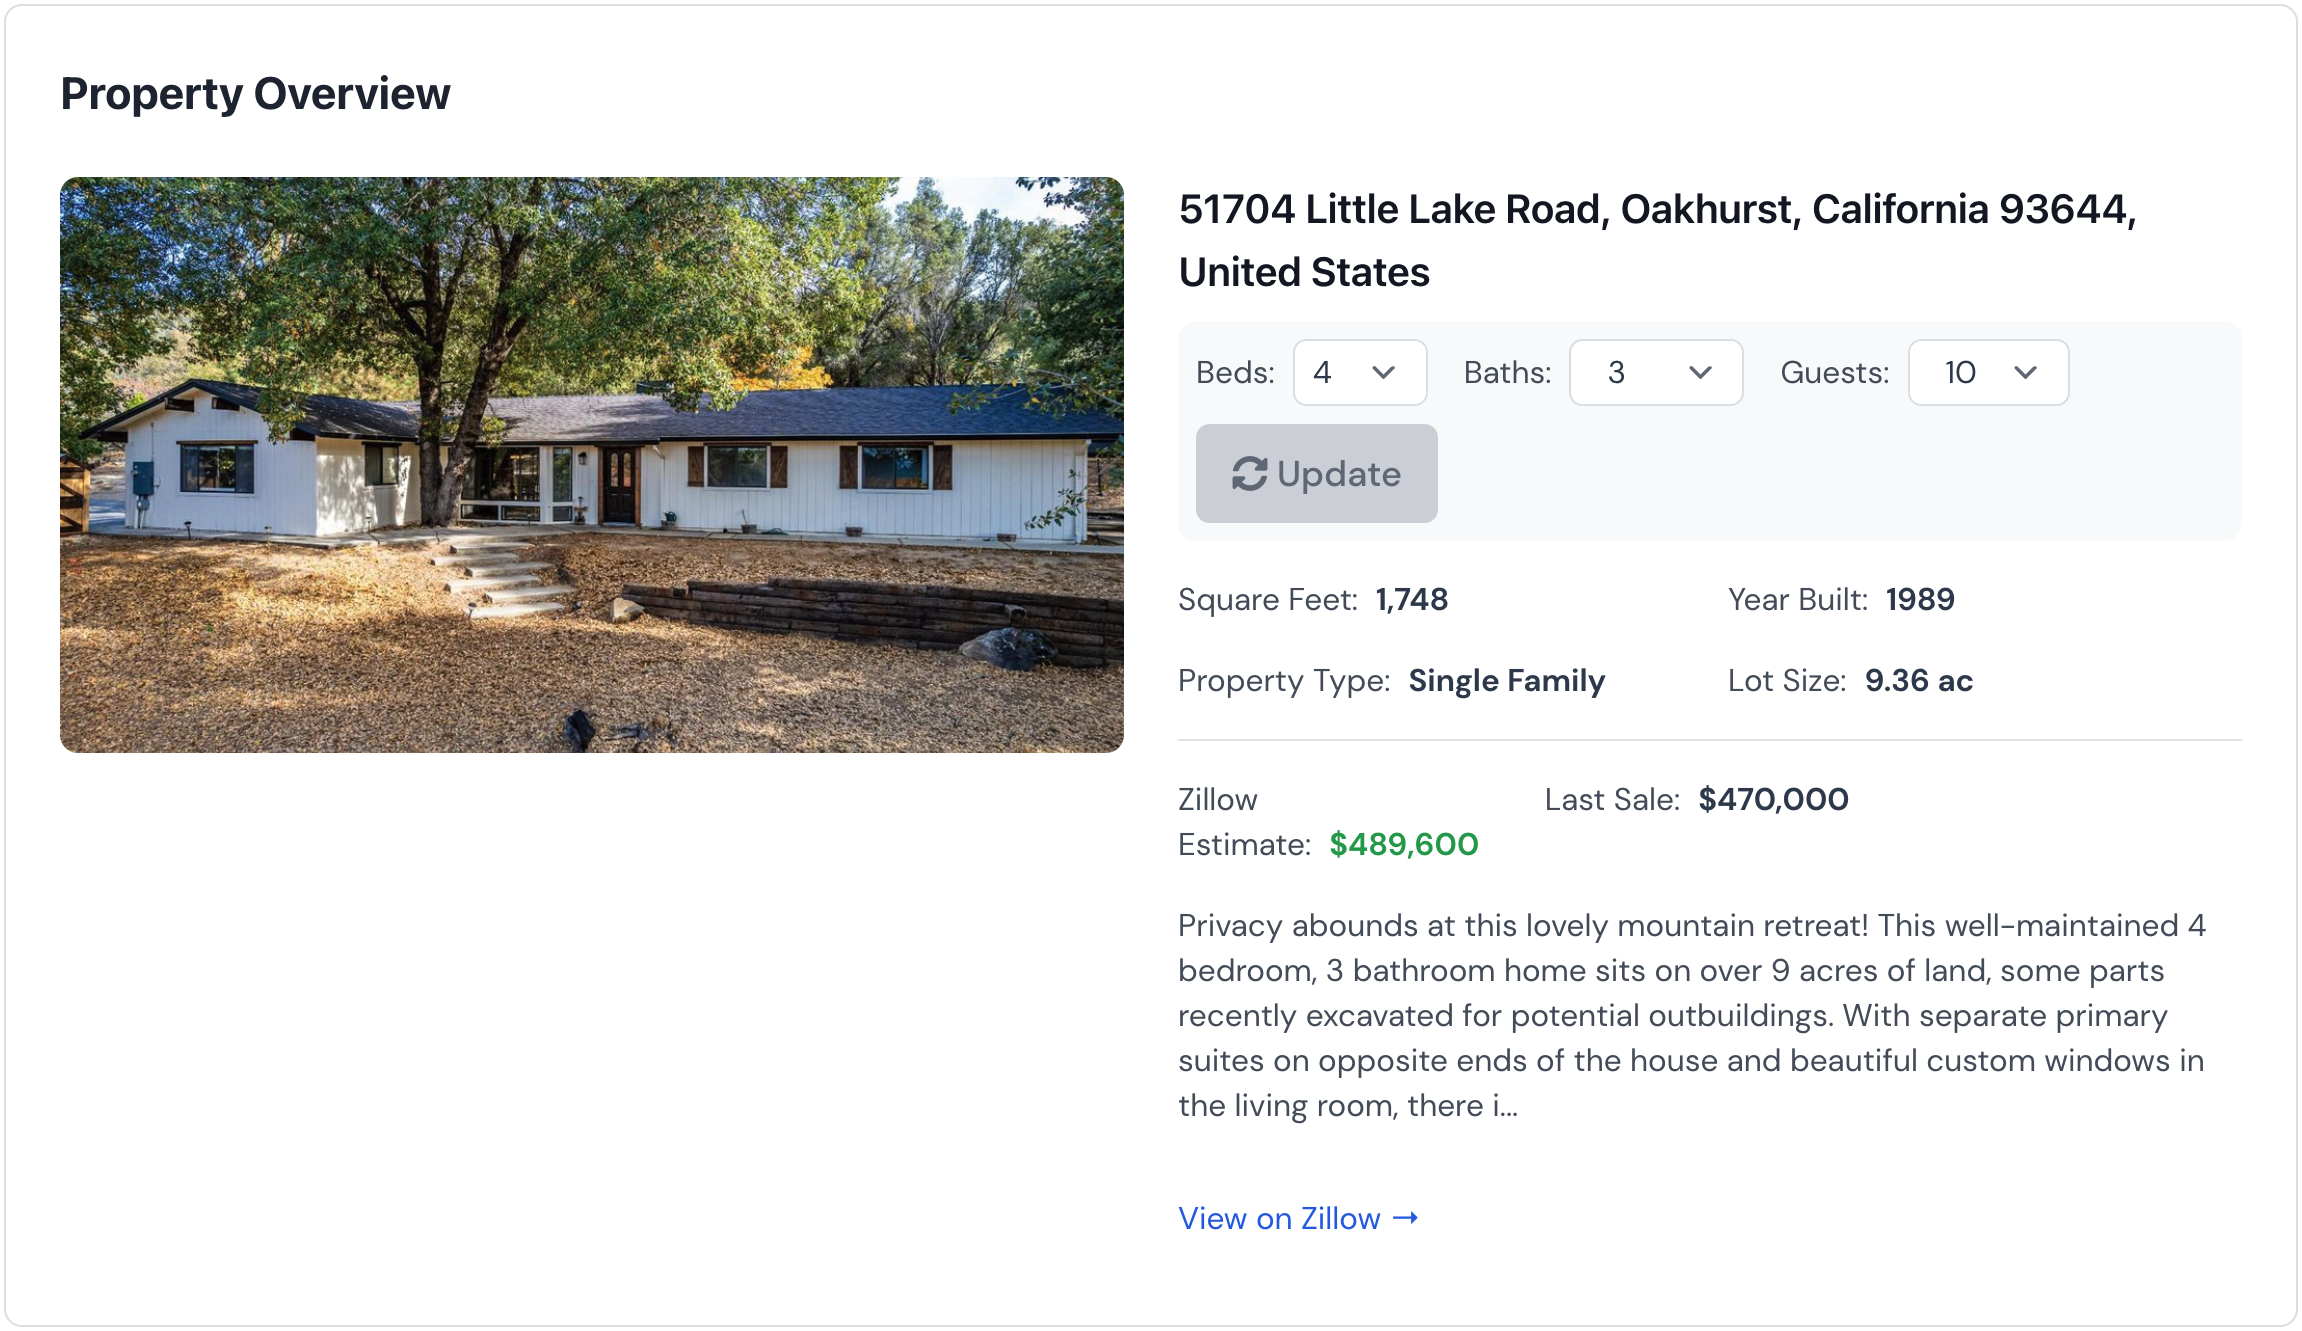
1) Enter The Address
Open the Property Analyzer and paste or type the full address. Select the correct match from autocomplete when available, then click Analyze. The analyzer fetches market comparables and generates revenue ranges tailored to the property’s location and characteristics.
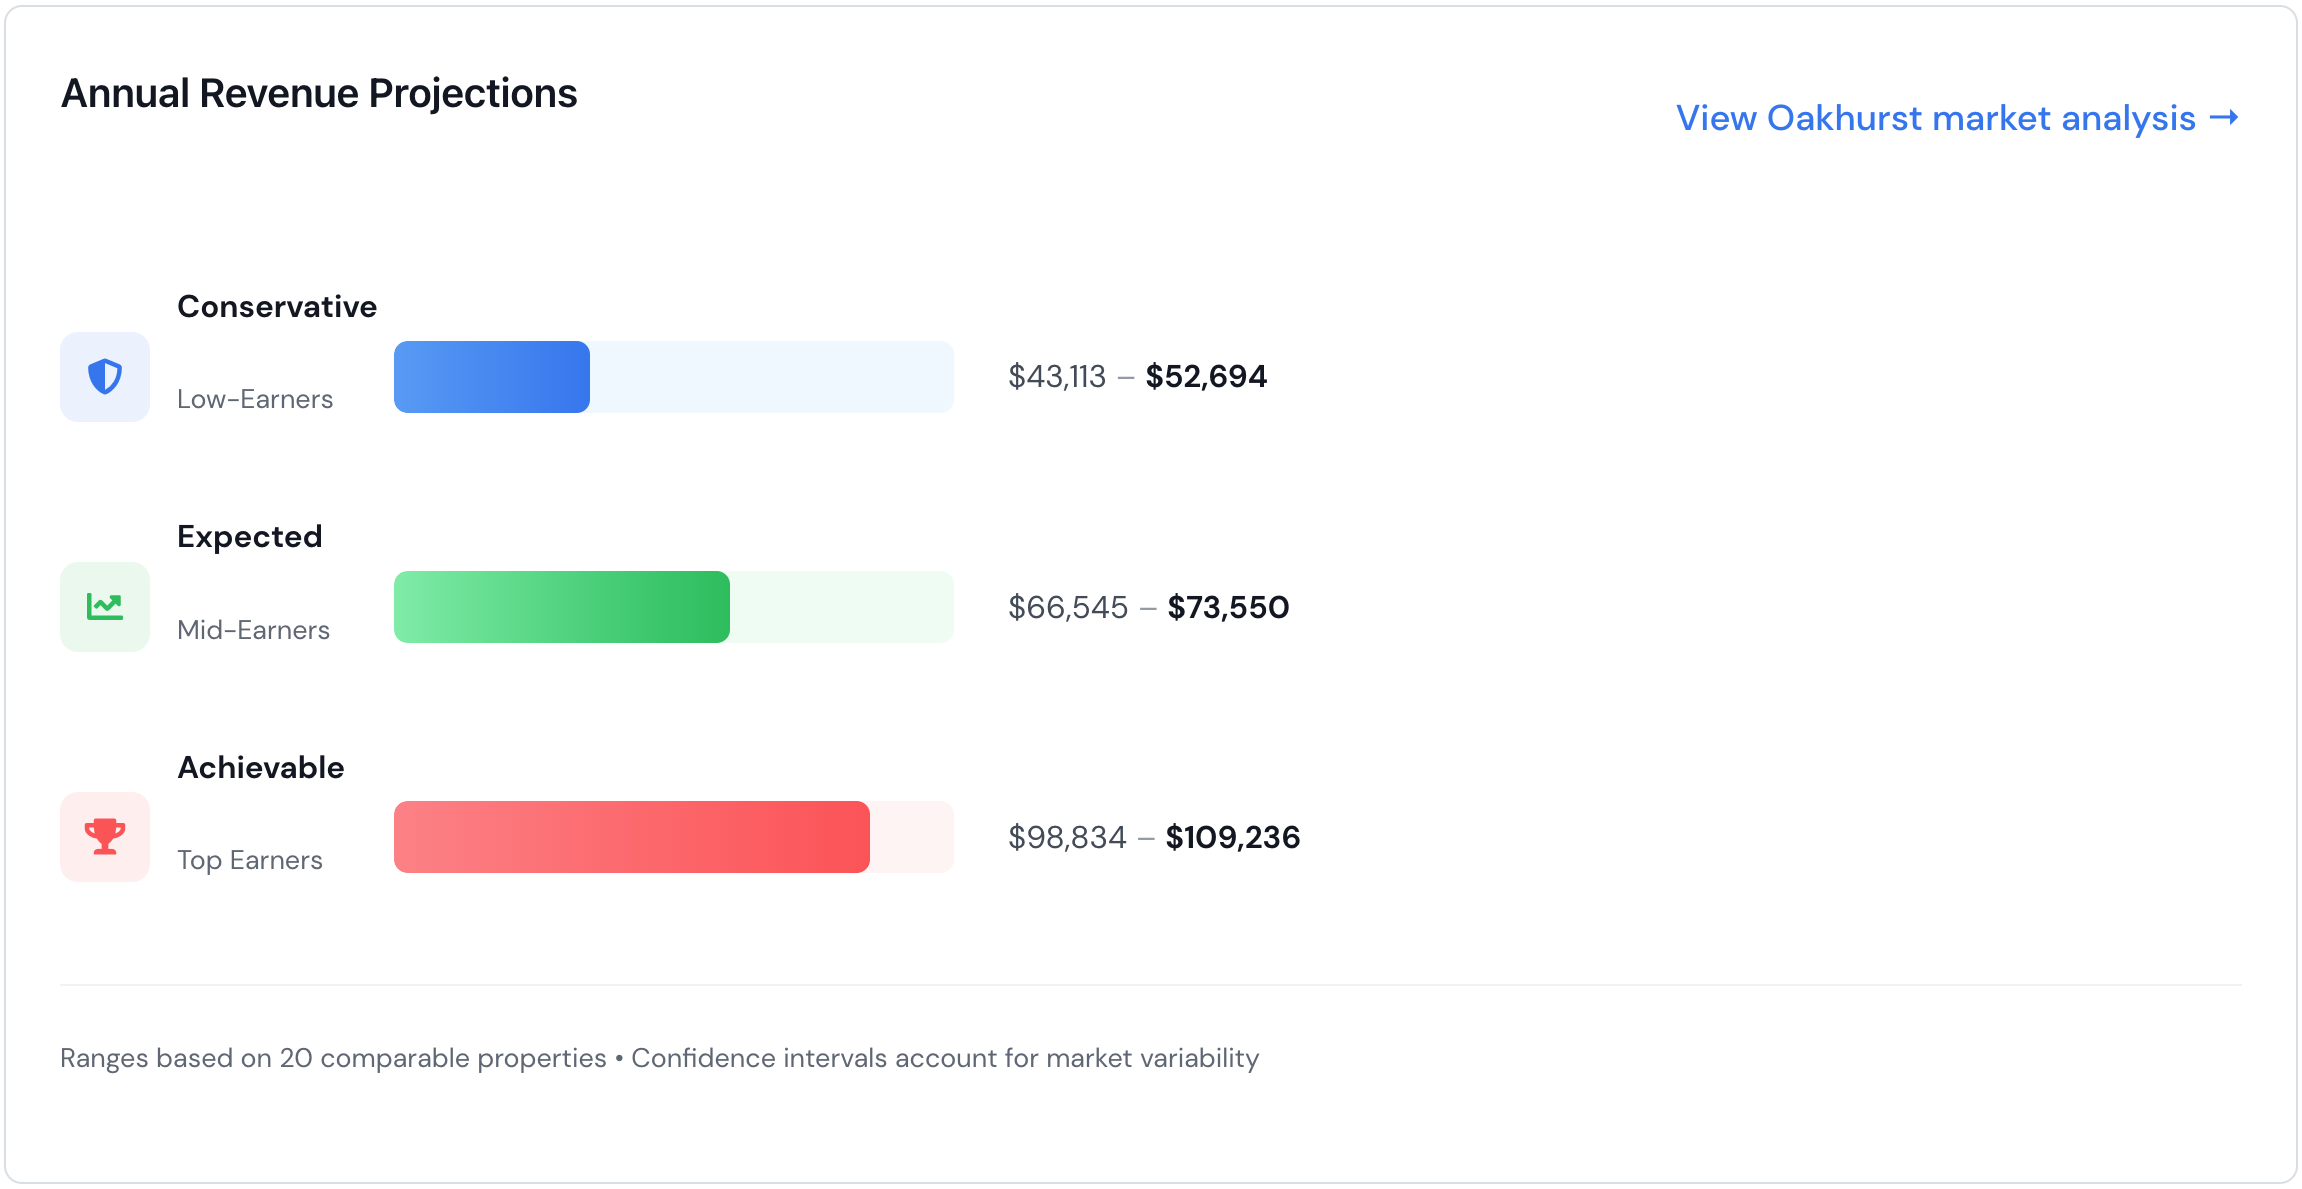
Understanding The Revenue Ranges
You’ll see three ranges—Conservative, Moderate, and Optimistic—each with a minimum and maximum annual revenue. These bands incorporate comp quality, variability, and market dynamics. If the sample size is small, we apply a transparent confidence widening to keep projections realistic.
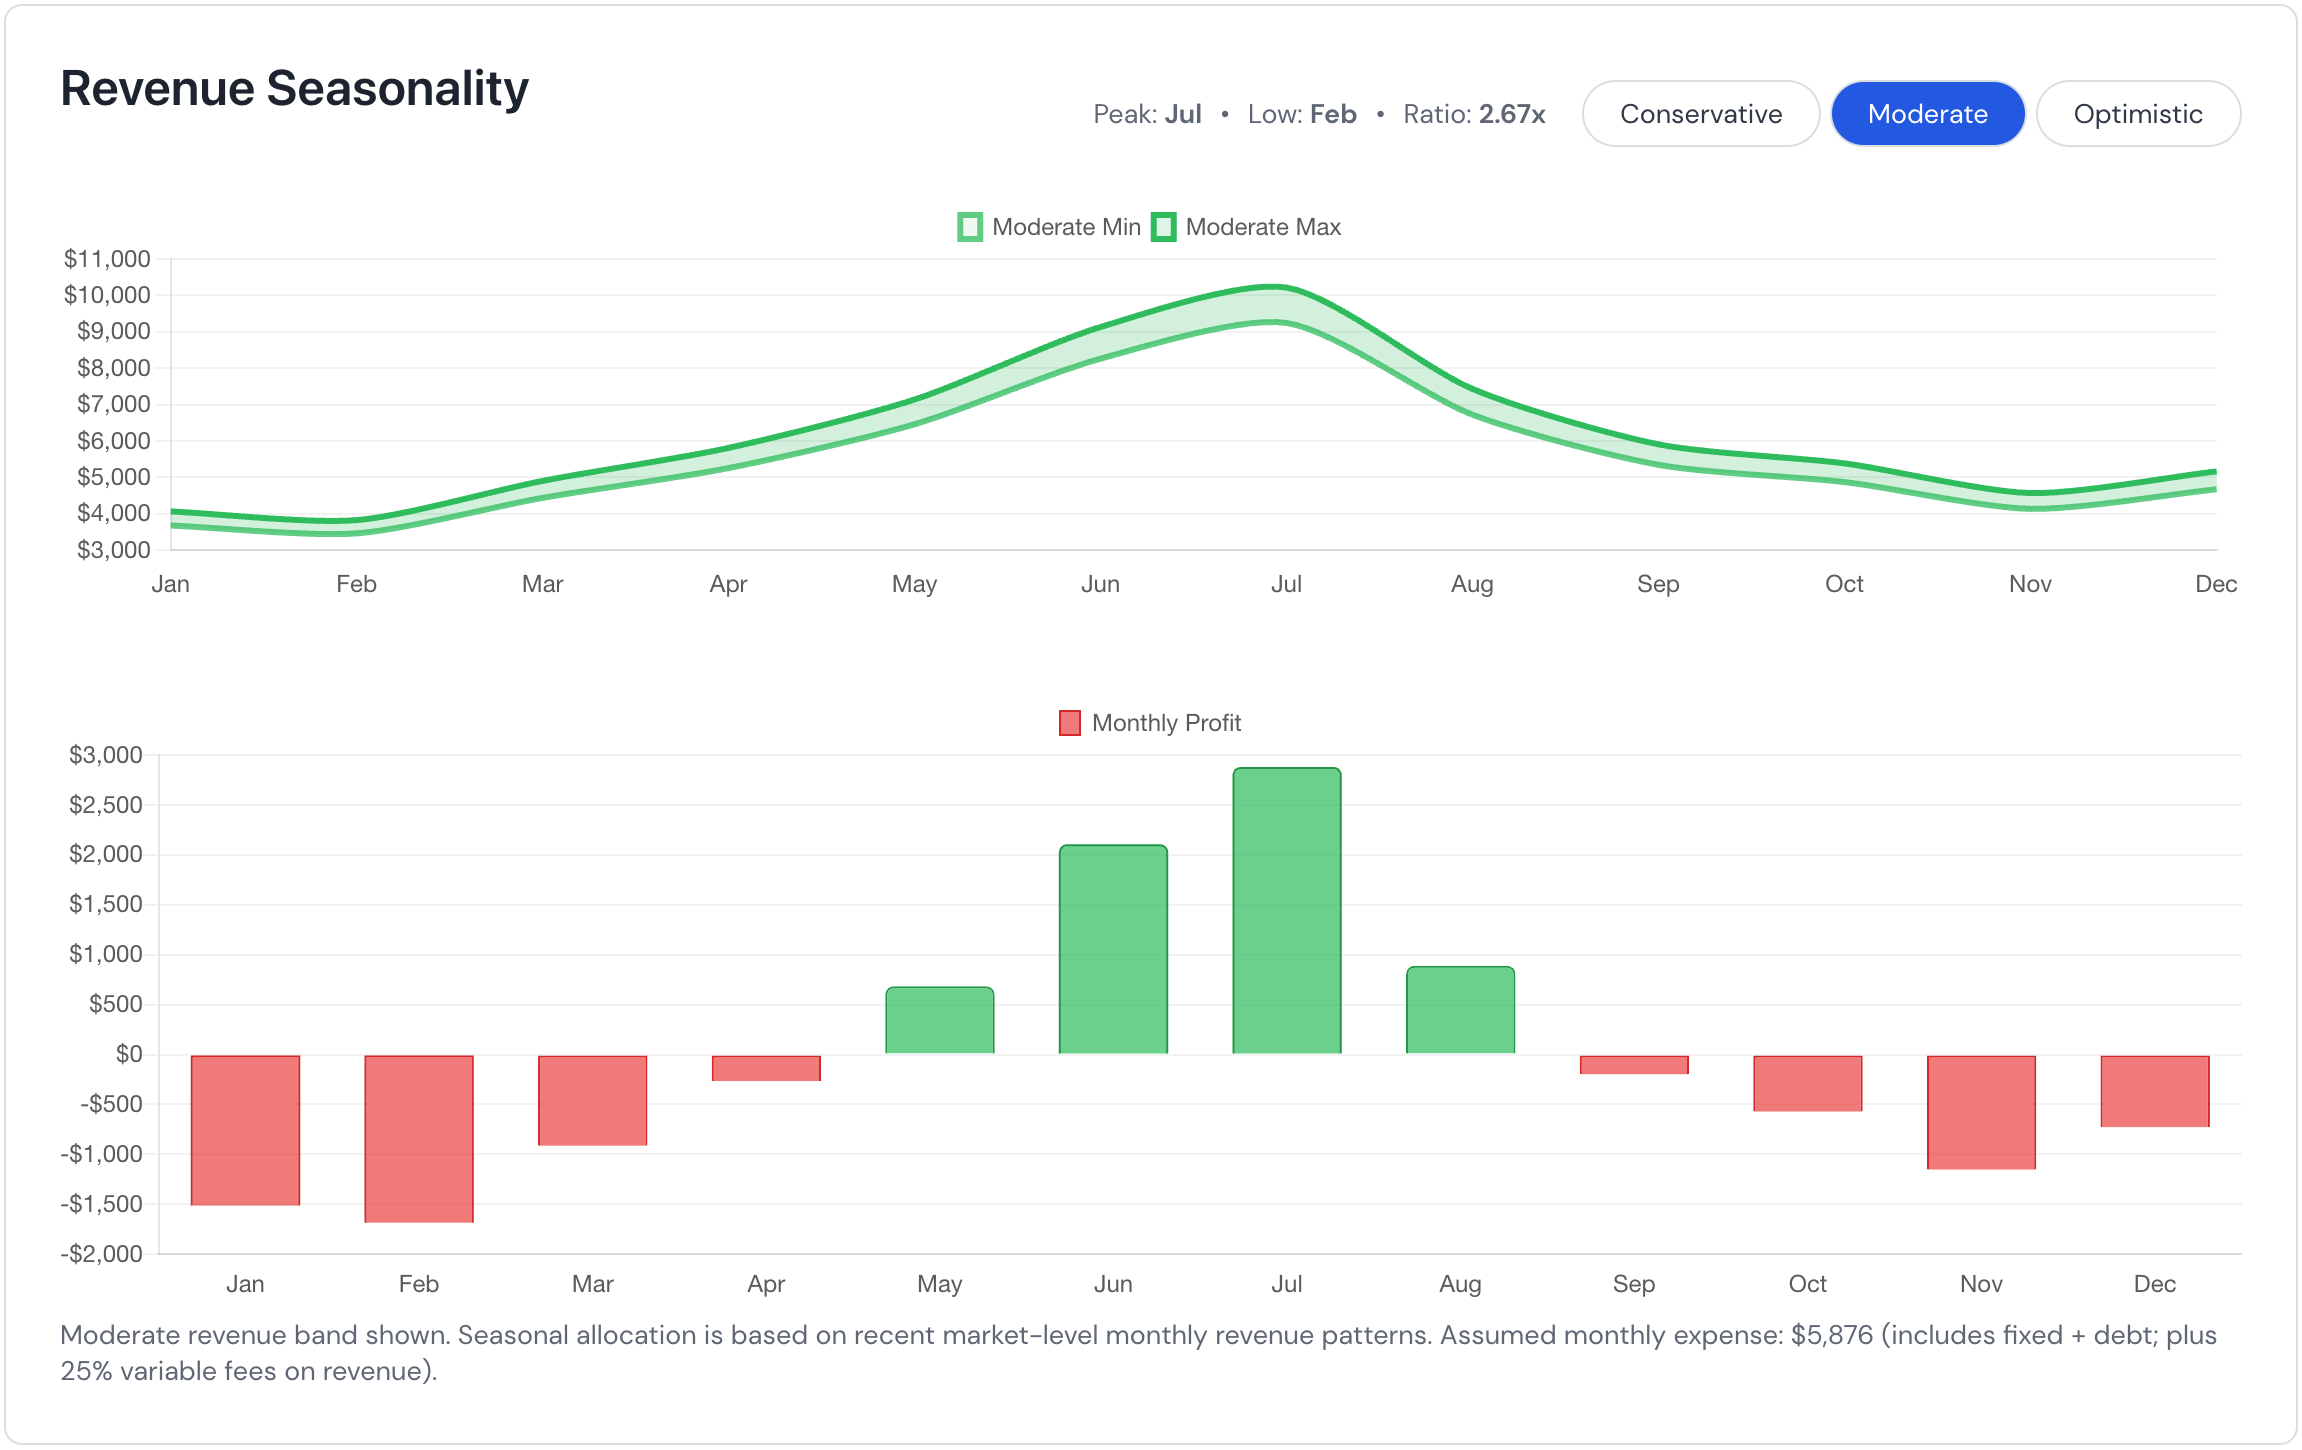
2) Choose A Seasonality Band
Seasonality distributes annual revenue across months to reflect real booking patterns. Use the band selector to switch between Conservative, Moderate, and Optimistic monthly curves. The analyzer automatically updates the annual revenue used by the financial calculator to the midpoint of the selected band.
3) Review Comparables
The analyzer lists the most similar nearby properties (map + table). Use this to sanity‑check nightly rates, occupancy patterns, and amenity alignment. Properties are ordered by similarity; expand to view the full list if needed.
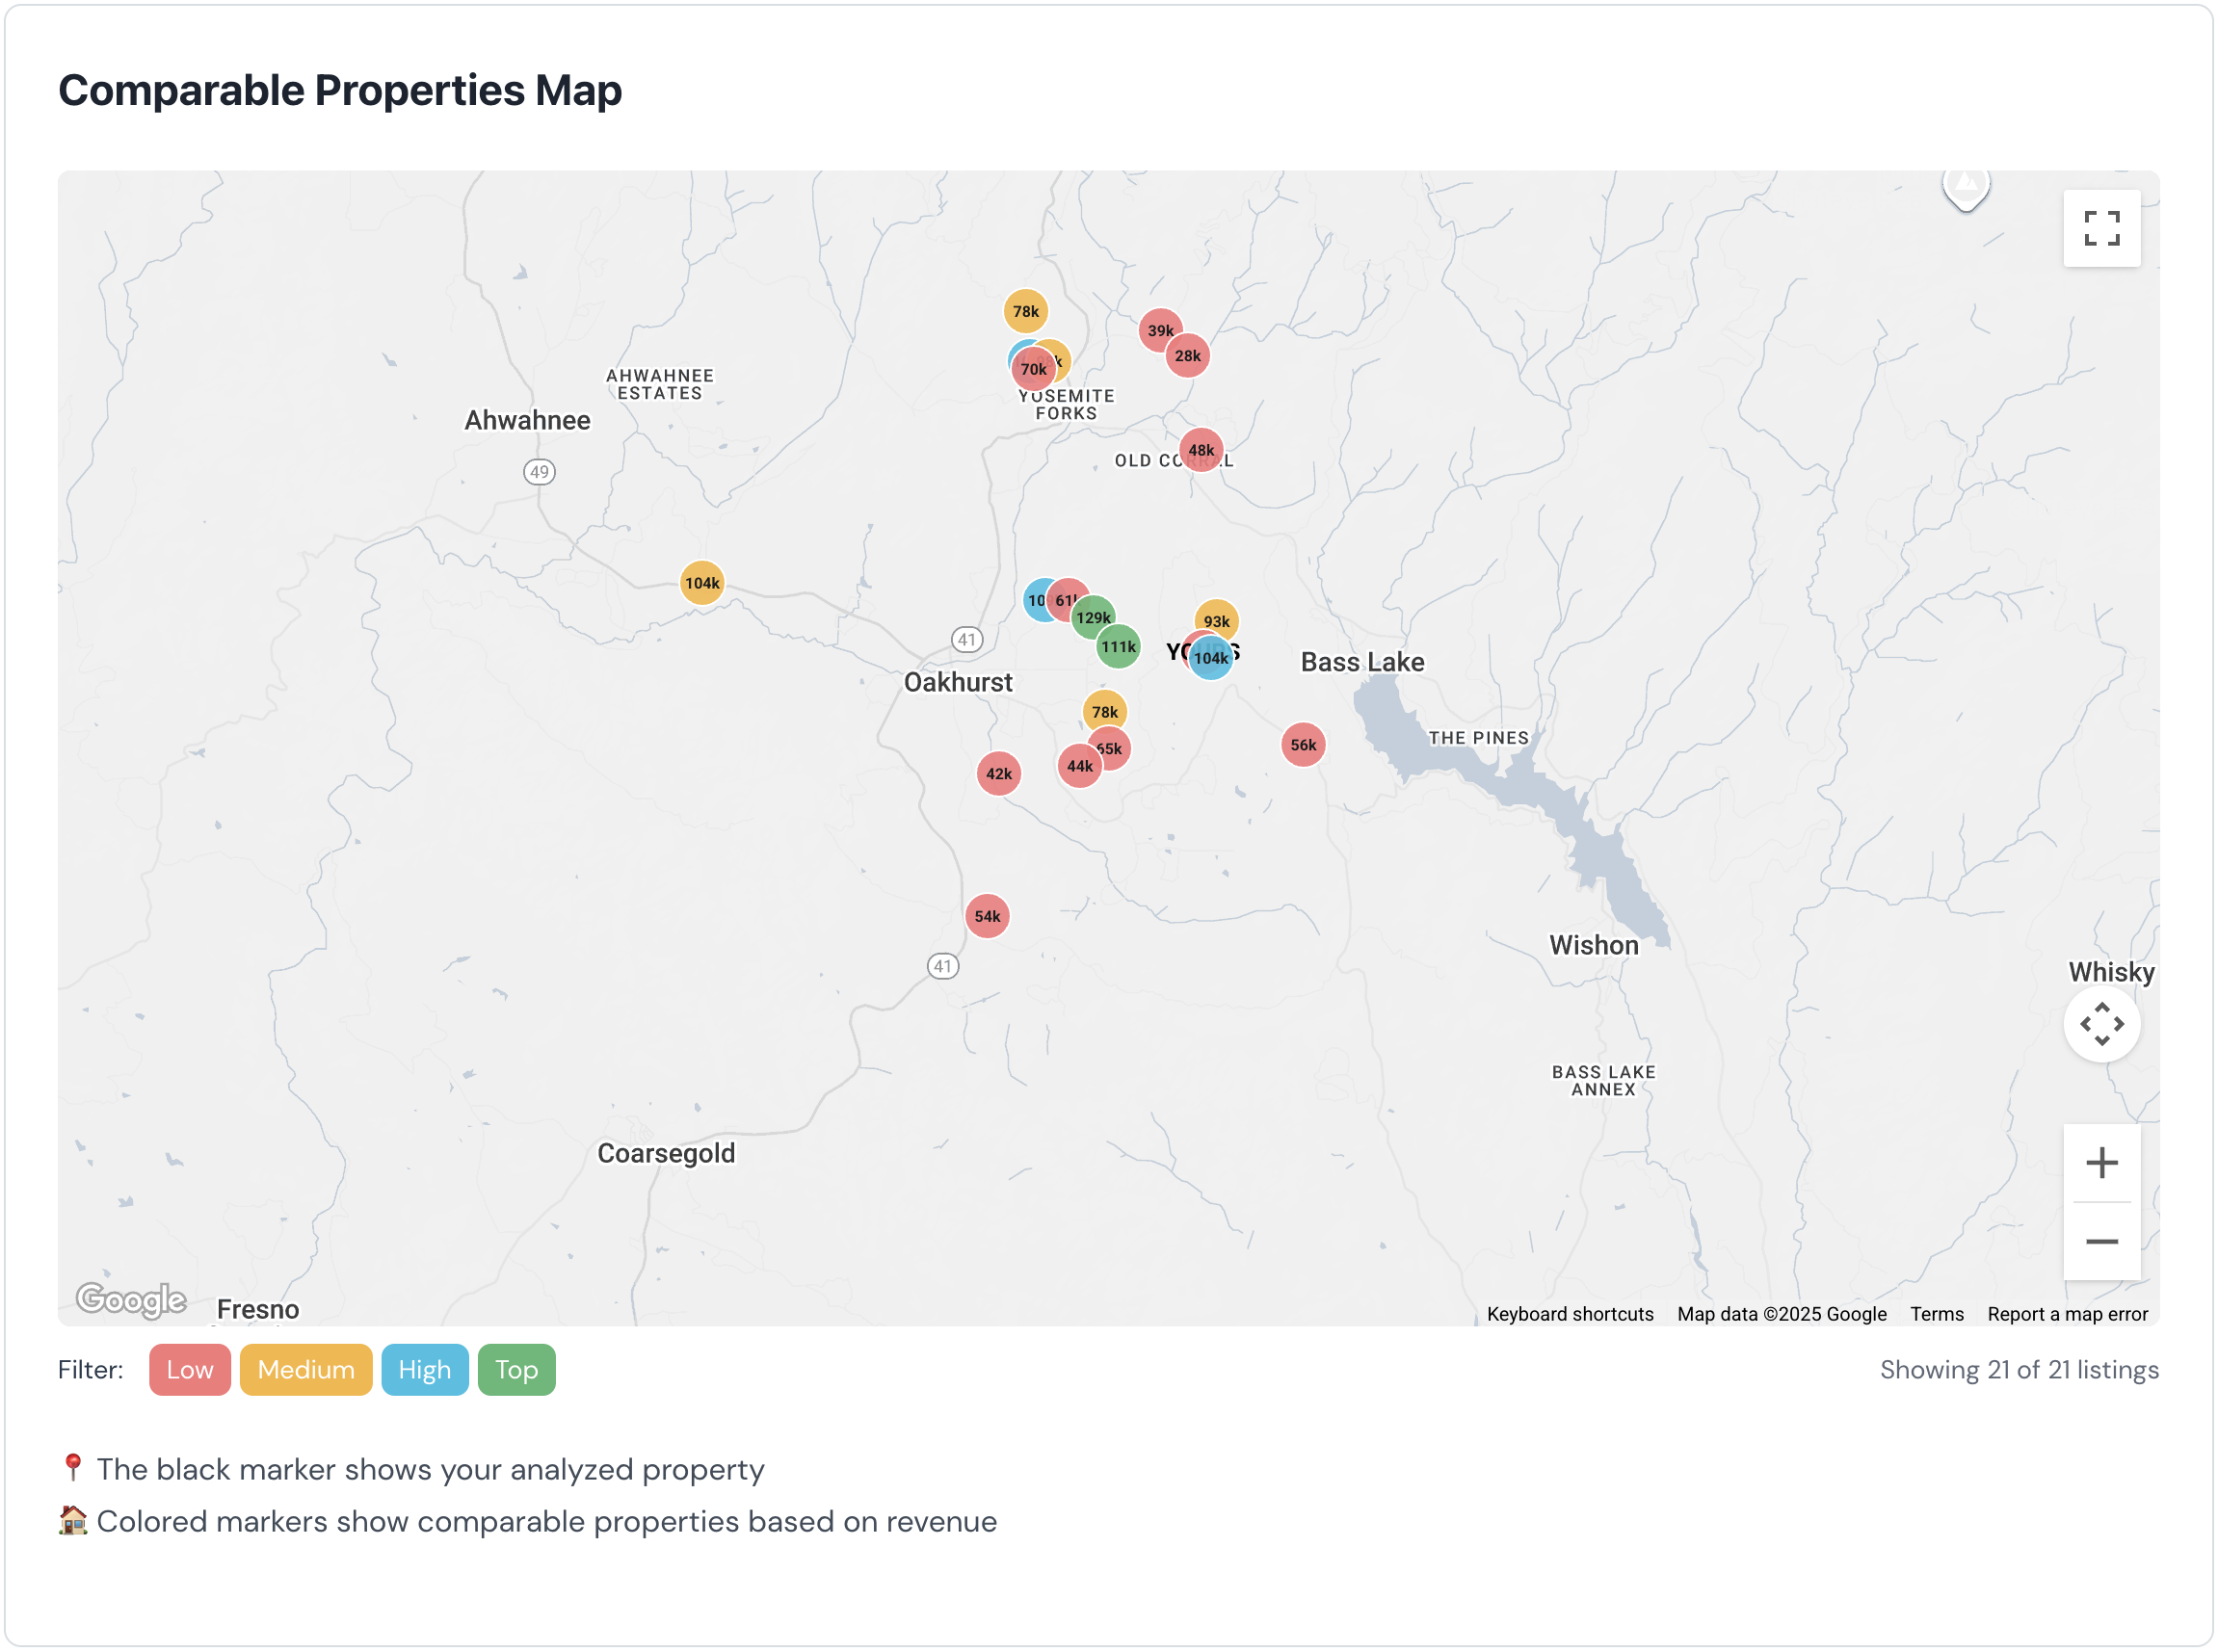
- If comps sleep fewer guests than your target, your ADR may be higher—adjust guests accordingly.
- If top comps have premium amenities (hot tub, views), factor upgrade costs or temper expectations.
- Use the map to confirm your property isn’t on the edge of an underperforming micro‑location.
4) Adjust Bedrooms, Bathrooms, and Guests
If the auto‑detected details differ from your plan (e.g., converting a den to a bedroom), set the edited bedrooms/bathrooms/guests and re‑run the analysis. This refreshes comps and the revenue model to reflect the updated sleeping capacity.
5) Enter Financing & Operating Assumptions
Open the Financial Calculator by clicking on "Update Estimate" button to model debt service and operating costs. You can adjust all key inputs used by lenders and investors:
- Purchase Price and Revenue (pre‑filled from the selected band)
- Down Payment %, Interest Rate %, Loan Term, and optional Points %
- Management, Lodging/Occupancy Tax, Property Tax (as % or fixed where applicable)
- Cleaning, Insurance, Maintenance, Utilities, HOA, Other Expenses (fixed amounts)
- Startup Costs: furnishings, improvements, closing costs, other startup
Key Outputs To Watch
- NOI: Revenue minus all operating expenses
- Cap Rate: NOI ÷ Purchase Price
- Gross Yield: Revenue ÷ Purchase Price
- Debt Service & DSCR: NOI ÷ Annual Debt Service
- Cash Flow: NOI − Annual Debt Service (monthly/annual)
- Cash‑on‑Cash: Annual Cash Flow ÷ Cash Invested (down payment + points + startup)
Case Study Walkthrough: Example Inputs
For 123 Meadow Lane, Suburbia, TX, assume: List Price $525,000, Moderate band midpoint annual revenue $78,000.
- Down Payment: 20%
- Interest Rate: 7.00%
- Term: 30 years
- Points: 0%
- Management: 20% of revenue
- Lodging Tax: 5% of revenue
- Property Tax: 1% of price
- Cleaning, Maint., Insurance: market‑typical
- Furnishings: $20,000
- Improvements: $10,000
- Closing Costs: $7,000
- Other: $3,000
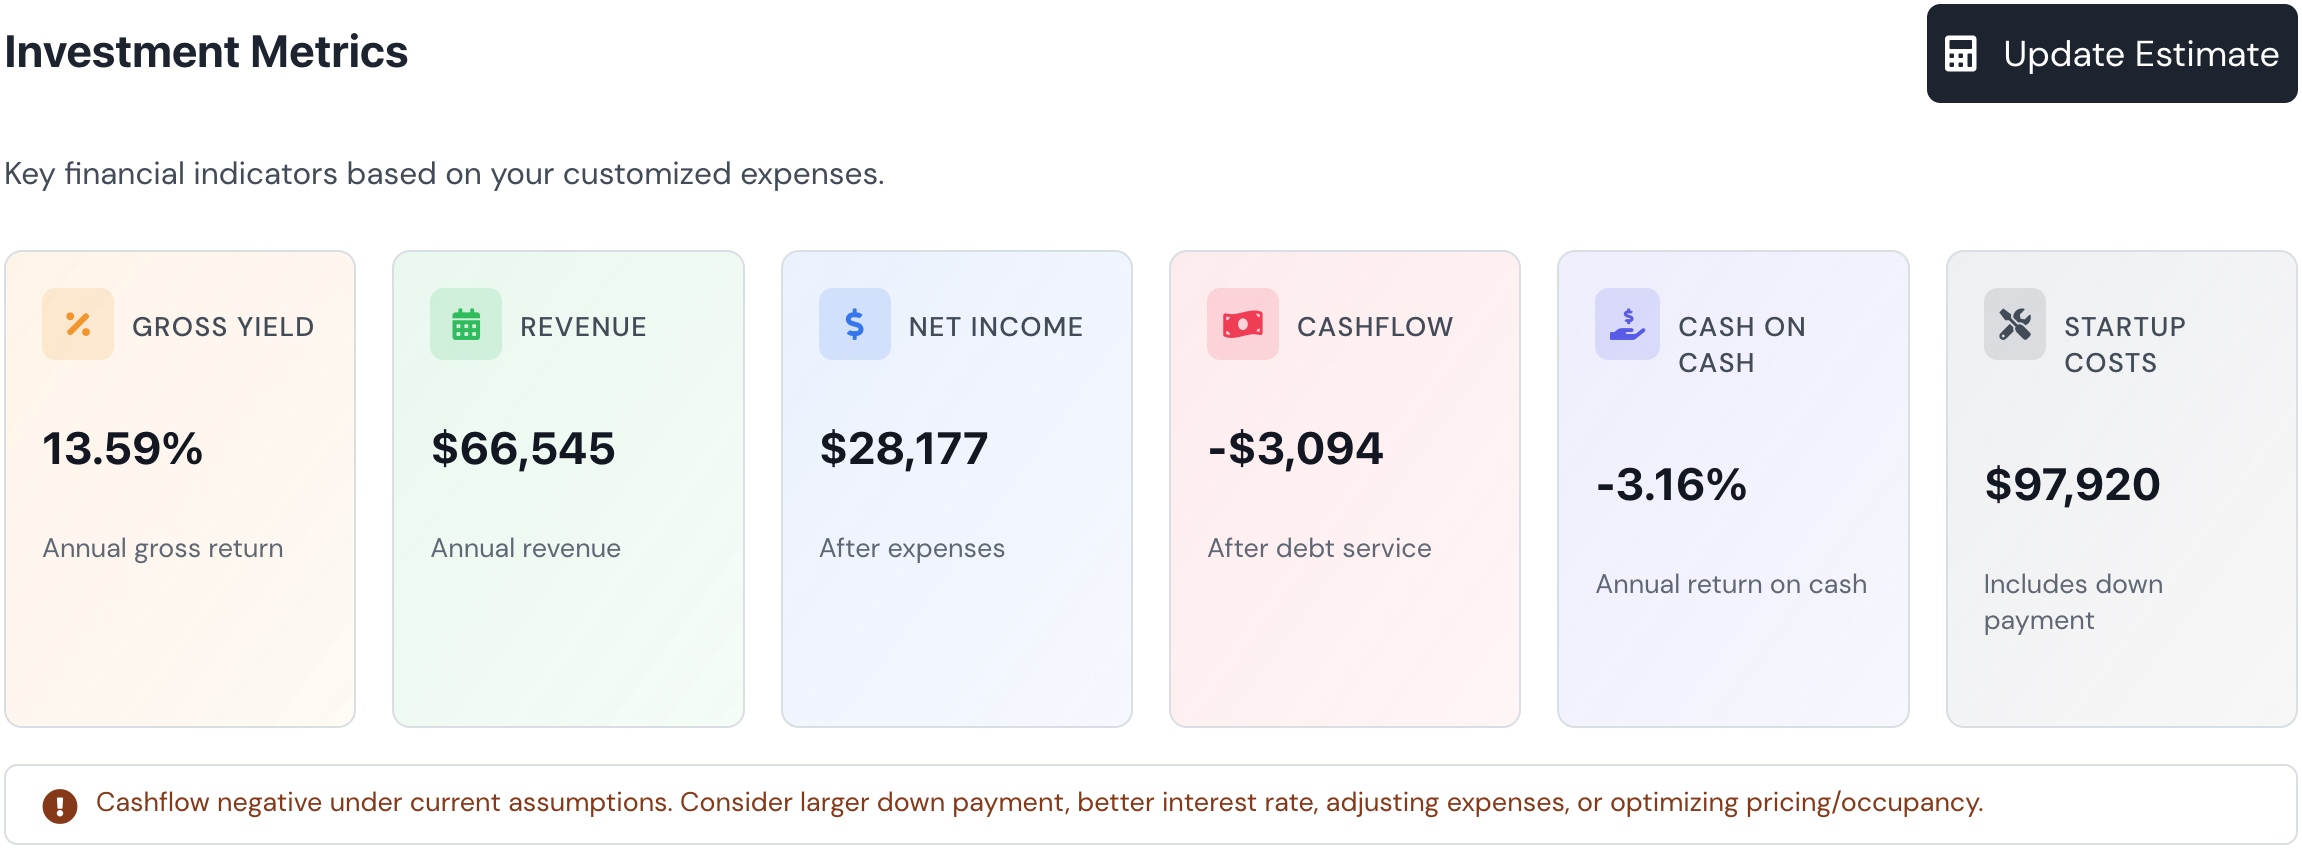
Interpreting The Results
With the assumptions above, you’ll see updated NOI, cap rate, DSCR, and cash‑on‑cash. If DSCR is below your lender’s threshold (commonly 1.2–1.3), try a slightly larger down payment, a lower rate (with points), or a more conservative expense estimate. If cash‑on‑cash is thin, explore pricing optimizations or operational improvements (e.g., pro cleaning turnovers, amenity upgrades) and re‑run the Moderate vs. Optimistic scenarios.
6) Sensitivity And Scenario Testing
Toggle between seasonality bands to see annual revenue shifts and month‑by‑month volatility. Re‑run the analysis after editing bedrooms/guests or adjusting startup improvements (like adding a hot tub) to quantify expected revenue lift vs. cost.
7) Export A PDF Underwriting Package
Click Download PDF to export a clean, client‑ready package including summary metrics, charts, comparable map, and assumptions. If you’re on a lender call or sharing with partners, attach this PDF for fast alignment.
Pro Underwriting Checklist
- Verify address, property type, and sleeping capacity are correct
- Skim comps for outliers and amenity mismatches
- Use Moderate band for baseline; Conservative for lender sensitivity
- Confirm taxes/HOA/insurance with local quotes when available
- Include realistic startup/improvement costs and timeline
- Target DSCR ≥ 1.25 and positive monthly cash flow post‑startup
Where To Go Next
- Deep‑dive market analytics to pressure‑test your revenue view
- Buy Box analysis to align property features to market demand
- Dynamic pricing to boost ADR without sacrificing occupancy
Accurate — Actionable — Insightful
Find Hidden Airbnb Gems Others Miss
With STR Profit Map’s in-depth analytics, interactive profit maps, AI-powered buy boxes, and Country Explorer, uncover hidden gems, optimize guest experience, and maximize your STR profits.