Using the Profit Map Feature
Discover how to use our interactive Profit Maps to visualize investment opportunities and find the most profitable locations for your next STR property.
Using Profit Maps to Visualize Market Opportunities
See profitability in full color. Our interactive Profit Maps transform complex data into intuitive visual insights, helping you instantly identify high-ROI markets and avoid oversaturated areas.
What You'll Learn in This Guide
- How to navigate and filter our interactive profit maps
- Understanding the color-coding system for ROI visualization
- Techniques for identifying emerging market opportunities
- Strategies for avoiding oversaturated markets before they decline
The Power of Geospatial Analytics
Our brains process visual information 60,000 times faster than text. STRProfitMap's interactive heat maps leverage this capability, transforming complex market data into intuitive visual patterns that help you identify opportunities at a glance.
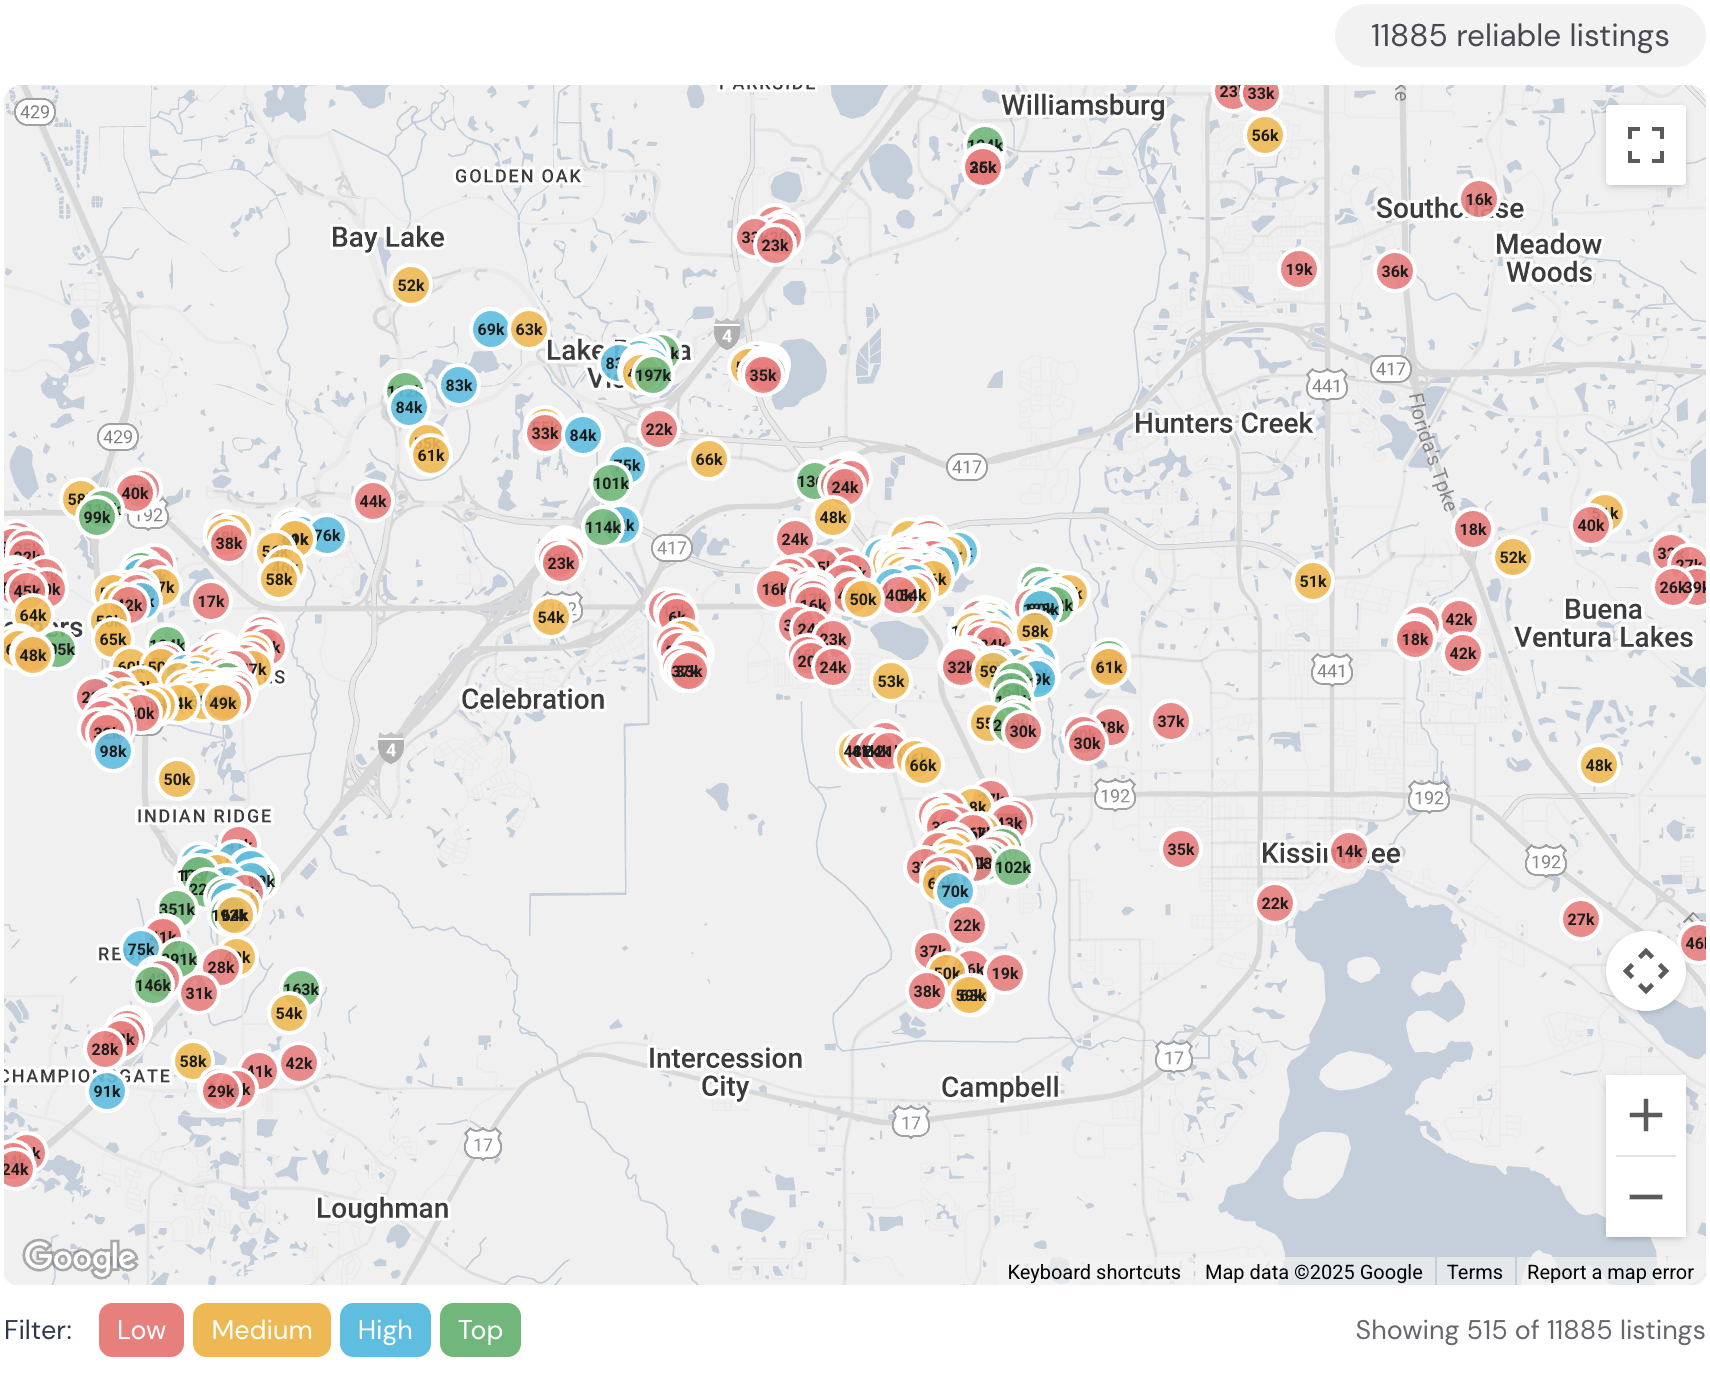
Understanding the Color Scale
Our profit maps use a carefully calibrated color system to highlight investment potential:
- Dark Green: Highest potential ROI – these areas show strong returns with favorable market conditions
- Light Green: Above-average potential – solid performer with room for optimization
- Yellow: Average returns – stable but not exceptional performance
- Orange: Below average – proceed with caution, these markets may face challenges
- Red: Poor investment potential – high risk factors or severely oversaturated markets
Real Investor Case Study
"I was set on investing in a popular beach town until I pulled up STRProfitMap's profit map. While the downtown area was deep red (oversaturated), I noticed a pocket of bright green just 2 miles inland. Properties there were 30% cheaper but generated nearly the same revenue as beachfront units. I purchased three properties in the green zone and my portfolio is outperforming beachfront investments by 22% in net cash flow."
- Sarah K., Portfolio Investor
Navigating the Profit Map Interface
1. Map View Controls
- Zoom Level: Adjust to view state-wide trends or zoom in for neighborhood-level insights
- Map Overlay: Toggle between satellite, street, and terrain views for additional context
- Heat Map Opacity: Adjust transparency to better see underlying geography
- Location Search: Quickly navigate to specific cities, neighborhoods, or addresses
2. Filtering Options
Customize your profit map view based on your specific investment criteria:
- Property Type: Filter by entire homes, condos, cabins, or unique properties
- Bedroom Count: Focus on units that match your investment targets
- Price Range: Set acquisition budget limits to see only viable options
- Performance Metrics: Choose to color-code by occupancy, ADR, or total revenue
- Minimum Night Requirements: Filter by regulatory restrictions
3. Data Layer Options
Overlay additional data to gain deeper context:
- Saturation Index: See how concentrated STR listings are in a given area
- Regulatory Status: Identify areas with favorable or challenging STR regulations
- Growth Trends: Visualize which areas are showing increasing or decreasing performance
- Seasonality Patterns: Understand how revenue fluctuates throughout the year
- Guest Origin Data: See where guests are traveling from to better target marketing
Strategic Applications of Profit Maps
1. Identifying Micromarket Opportunities
Locate high-potential pockets within larger markets:
- Look for "green islands" – areas of high profitability surrounded by average markets
- Identify emerging neighborhoods on the edges of established tourist areas
- Spot transition zones where performance is improving quarter over quarter
2. Avoiding Market Saturation
Stay ahead of oversupply trends that can erode returns:
- Monitor the saturation index overlay to identify markets approaching capacity
- Watch for declining occupancy rates even as listing counts increase
- Identify markets where new construction is outpacing demand growth
- Avoid areas showing steadily declining RevPAD despite stable ADR (indicates price competition)
3. Comparison Shopping
Use split-screen view to efficiently compare markets:
- Compare seasonal patterns between two potential investment areas
- Evaluate similar property types across different neighborhoods
- Assess regulatory risk by comparing areas with different STR policies
- Identify markets with similar performance but different acquisition costs
Pro Tip: Market Corridor Analysis
Look for "green corridors" – connected areas showing strong performance that may indicate expansion patterns:
- Identify established high-performing areas (dark green)
- Look for adjacent areas showing improving metrics (light green trending darker)
- Research infrastructure or development projects connecting these areas
- Target properties on the growth pathway before prices increase
- Monitor quarterly to stay ahead of expansion patterns
Action Plan: Profit Map Mastery
- Define Your Investment Parameters: Set property type, budget, and performance thresholds
- Start Broad, Then Narrow: Begin with state-level analysis, then zoom in on promising regions
- Compare Adjacent Areas: Look for value opportunities near established high-performing markets
- Layer on Regulatory Data: Eliminate areas with unfavorable STR regulations
- Analyze Seasonal Patterns: Use the seasonality overlay to understand revenue fluctuations
- Watch Growth Trends: Identify areas showing positive momentum over 6-12 months
- Save Custom Views: Create and save filtered maps for ongoing monitoring
Next Steps
Now that you understand how to utilize our profit maps, explore these related guides:
Accurate — Actionable — Insightful
Find Hidden Airbnb Gems Others Miss
With STR Profit Map’s in-depth analytics, interactive profit maps, AI-powered buy boxes, and Country Explorer, uncover hidden gems, optimize guest experience, and maximize your STR profits.