AI Insights for Buy Box Decisions
See how our AI-powered insights can help you make better buy box decisions and maximize your ROI on short-term rental investments.
Leveraging AI Insights for Data-Driven Investment Decisions
Transform property selection from guesswork to scientific precision. Our AI-powered insights analyze thousands of data points to identify exactly what drives booking performance in any market.
What You'll Learn in This Guide
- How our AI analyzes thousands of guest reviews to identify the exact features that drive bookings
- Techniques for using AI-powered insights to evaluate potential properties
- Methods for optimizing existing properties based on AI recommendations
- Strategies for gaining competitive advantage through data-driven amenity selection
- Step-by-step Buy Box analysis to maximize ROI on new acquisitions
The AI Advantage in STR Investing
The short-term rental market is increasingly competitive, with razor-thin margins between properties that struggle and those that thrive. STRProfitMap's AI provides a critical competitive edge by uncovering patterns that humans simply cannot detect across thousands of properties and reviews.
How Our AI Works
STRProfitMap's artificial intelligence engine processes massive datasets to deliver actionable insights:
- Review Analysis: Processes hundreds of thousands of guest reviews to identify exactly what guests value in each market
- Property Performance Correlation: Connects specific amenities and features to revenue performance
- Sentiment Detection: Identifies which features generate the most positive or negative reactions
- Competitive Gap Analysis: Highlights opportunities where market demand exceeds supply
- Pricing Impact Calculation: Quantifies the revenue impact of specific property features
Real Investor Case Study
"I was considering two similar mountain cabins for my next purchase - both 3BR/2BA with similar locations. STRProfitMap's AI analysis revealed that in this specific market, properties with outdoor hot tubs mentioned in the top three amenities averaged 38% higher RevPAR than those without. The second property had space for a hot tub addition. I negotiated $25K off the purchase price based on this insight, added a $12K hot tub, and now earn 41% more than comparable properties without this feature. The AI literally paid for itself in the first three months."
- David K., Mountain Property Investor
Using AI Insights for Property Evaluation
1. Market-Specific Feature Analysis
Every market has unique value drivers. Our AI identifies exactly what matters in your target location:
| Market Type | Top Value-Driving Features (Examples) | Estimated Revenue Impact |
|---|---|---|
| Beach Destinations | Ocean view, beach access, outdoor shower | +15-45% for direct ocean views |
| Mountain Retreats | Mountain views, hot tubs, fireplaces | +20-35% for hot tub + view |
| Urban Apartments | Walkability score, quiet bedrooms, workspace | +10-25% for prime walkability |
| Lake Properties | Water access, dock availability, sunset views | +30-60% for waterfront locations |
| Desert Retreats | Private pools, outdoor living space, A/C quality | +25-40% for private pool |
*These examples illustrate typical findings. STRProfitMap's AI provides market-specific data for your exact location.
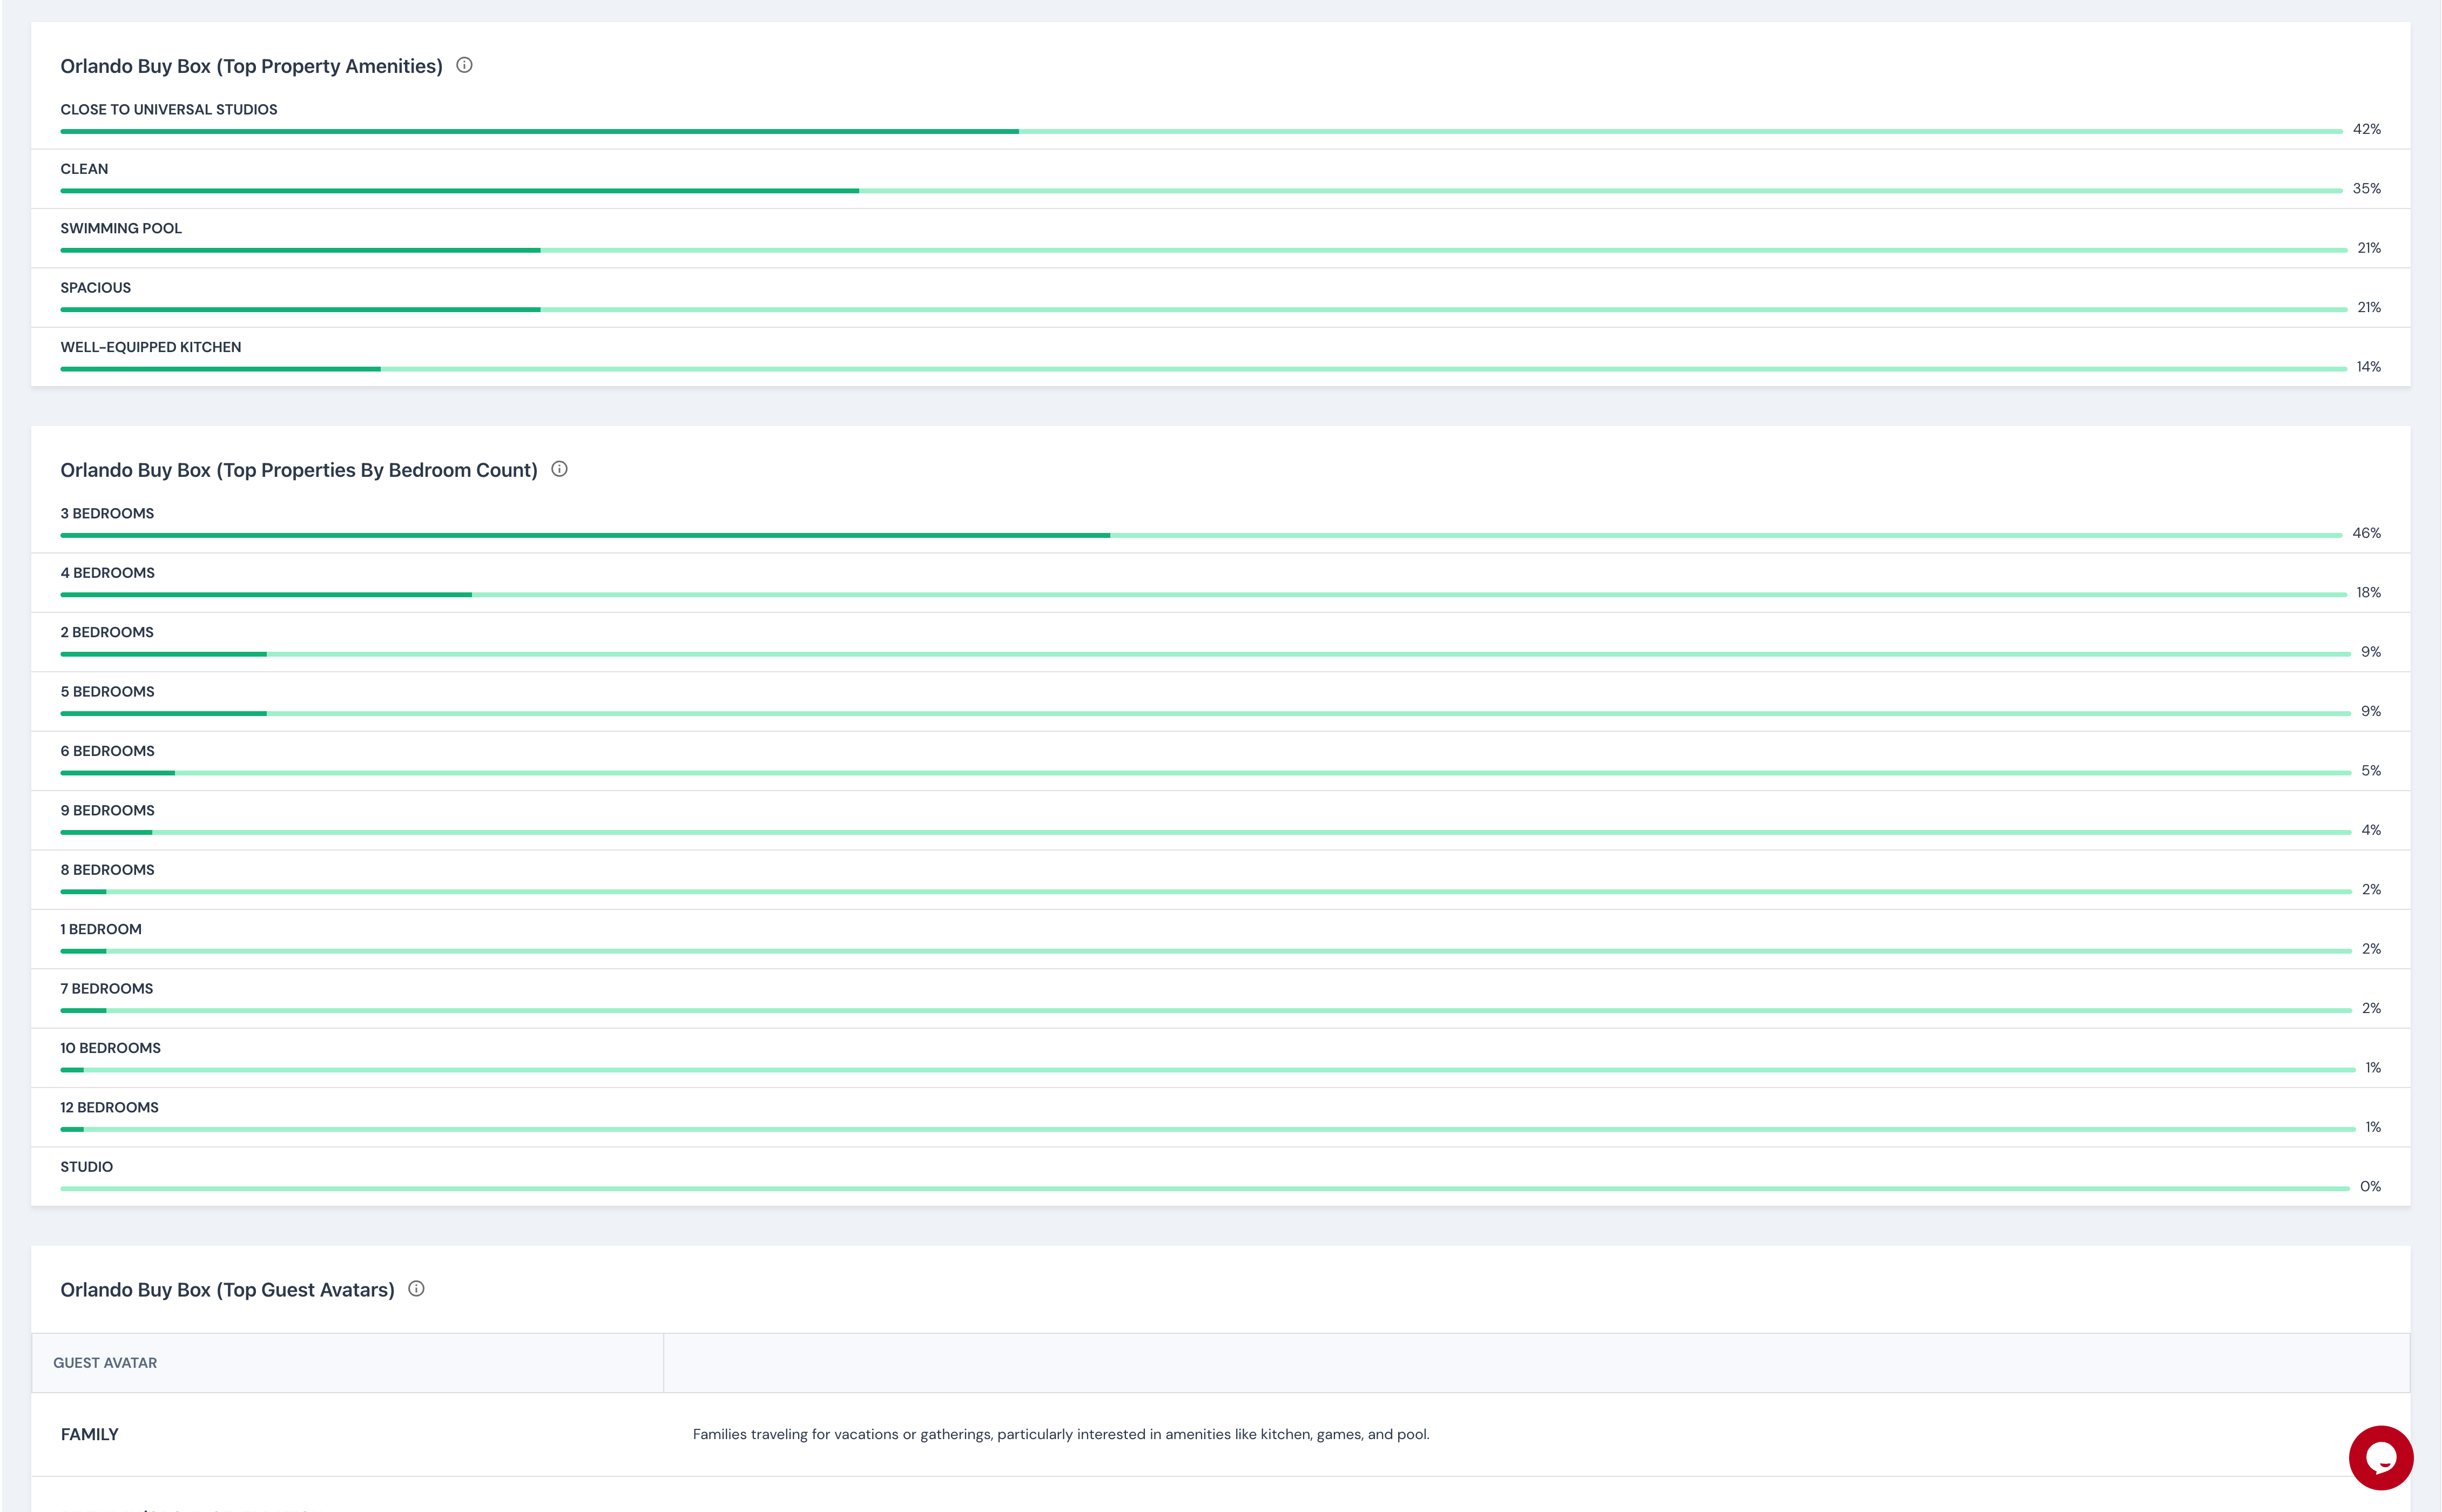
2. AI-Powered Buy Box Analysis
When evaluating a specific property, our AI Buy Box feature provides a comprehensive analysis:
- Revenue Potential Score: AI-generated prediction of earning capacity relative to the market
- Feature Gap Analysis: Identification of missing high-value amenities that could be added
- Guest Demographic Match: Alignment between property attributes and target guest profiles
- Competitive Positioning: How the property stands against direct competitors
- ROI Enhancement Opportunities: Specific recommendations for highest-impact improvements
3. Confidence Score Interpretation
Our AI provides a confidence score with each analysis. Understanding this metric is crucial:
- 90%+ Confidence: Extremely reliable prediction based on substantial data
- 75-89% Confidence: Strong prediction with good supporting evidence
- 60-74% Confidence: Moderate reliability, consider additional factors
- Below 60% Confidence: Limited data available, use as one input among many
Even lower confidence scores provide valuable directional guidance, but should be weighted accordingly in your decision-making process.
Optimizing Existing Properties with AI Insights
1. ROI-Ranked Enhancement Recommendations
For properties already in your portfolio, our AI identifies optimization opportunities ranked by expected return:
- Compare your property's features against top performers in your exact market
- Receive specific recommendations prioritized by revenue impact
- See estimated costs versus revenue enhancement for each recommendation
- Identify quick wins versus longer-term investments
2. Listing Optimization Through AI
Our AI analyzes top-performing listings to help you optimize your property presentation:
- Title Enhancement: AI-generated recommendations for keyword optimization
- Description Focus: Guidance on which features to emphasize based on guest preferences
- Photo Sequence: Optimal order of images based on click-through analysis
- Amenity Highlighting: Which features deserve prominent mention versus which can be secondary
3. Predictive Maintenance Planning
AI helps you stay ahead of potential issues that could impact reviews:
- Identify the most common maintenance-related complaints in your market
- Receive alerts for seasonal maintenance needs before they impact guests
- Get guidance on replacement cycles based on review sentiment analysis
- Prioritize upgrades based on guest feedback patterns
Pro Tip: The Amenity Value Matrix
Use our AI's data to create an Amenity Value Matrix for any property or market:
- Pull the top 10 value-driving amenities for your market from STRProfitMap's AI
- Create a spreadsheet with columns for Amenity, Installation Cost, Maintenance Cost, and Revenue Impact
- Calculate ROI for each potential addition or upgrade
- Prioritize based on fastest payback period and highest long-term value
- Implement in phases, starting with highest-ROI items
This systematic approach removes emotion from the upgrade decision process and ensures your capital is deployed for maximum return.
Advanced AI Applications for STR Investors
Competitive Benchmarking
Use AI insights to benchmark your property's performance against ideal competitors:
- Identify your property's true competitive set based on feature similarity
- Compare performance across key metrics (ADR, occupancy, RevPAR)
- Pinpoint specific areas where competitors outperform your property
- Develop targeted strategies to close performance gaps
Trend Anticipation
Our AI doesn't just analyze the past – it helps you anticipate future trends:
- Identify emerging amenity preferences before they become standard
- Monitor shifting guest demographics and their evolving needs
- Track sentiment changes around specific property features
- Get early warning of market saturation or new opportunities
Action Plan: Leveraging AI for Your STR Business
- Market Analysis: Use STRProfitMap's AI to analyze your target market's unique value drivers
- Property Evaluation: Run potential acquisitions through the AI Buy Box analyzer
- Feature Prioritization: Create your Amenity Value Matrix based on AI insights
- Implementation Planning: Develop a phased approach to property enhancements
- Listing Optimization: Update your property listing based on AI recommendations
- Performance Tracking: Monitor the impact of AI-guided changes on key metrics
- Regular Review: Refresh your AI analysis quarterly to capture evolving trends
Next Steps
Now that you understand how to leverage AI insights, explore these related guides:
Accurate — Actionable — Insightful
Find Hidden Airbnb Gems Others Miss
With STR Profit Map’s in-depth analytics, interactive profit maps, AI-powered buy boxes, and Country Explorer, uncover hidden gems, optimize guest experience, and maximize your STR profits.